So we are making this awesome Excel variance graph, the easiest actual vs target chart with floating bars, in 5 steps under 1 minute:
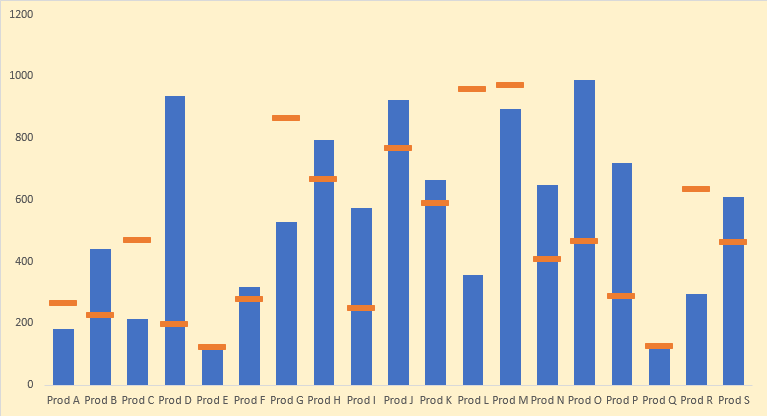
Excel Actual vs Target chart in 30 seconds or less!
Download this Excel workbook containing sample data and follow the steps in this tutorial to learn the technique better.
Step 1: Have an active cell inside data and Hit CTRL+A to select the data and then hit ALT+F1 to insert clustered column chart instantly.
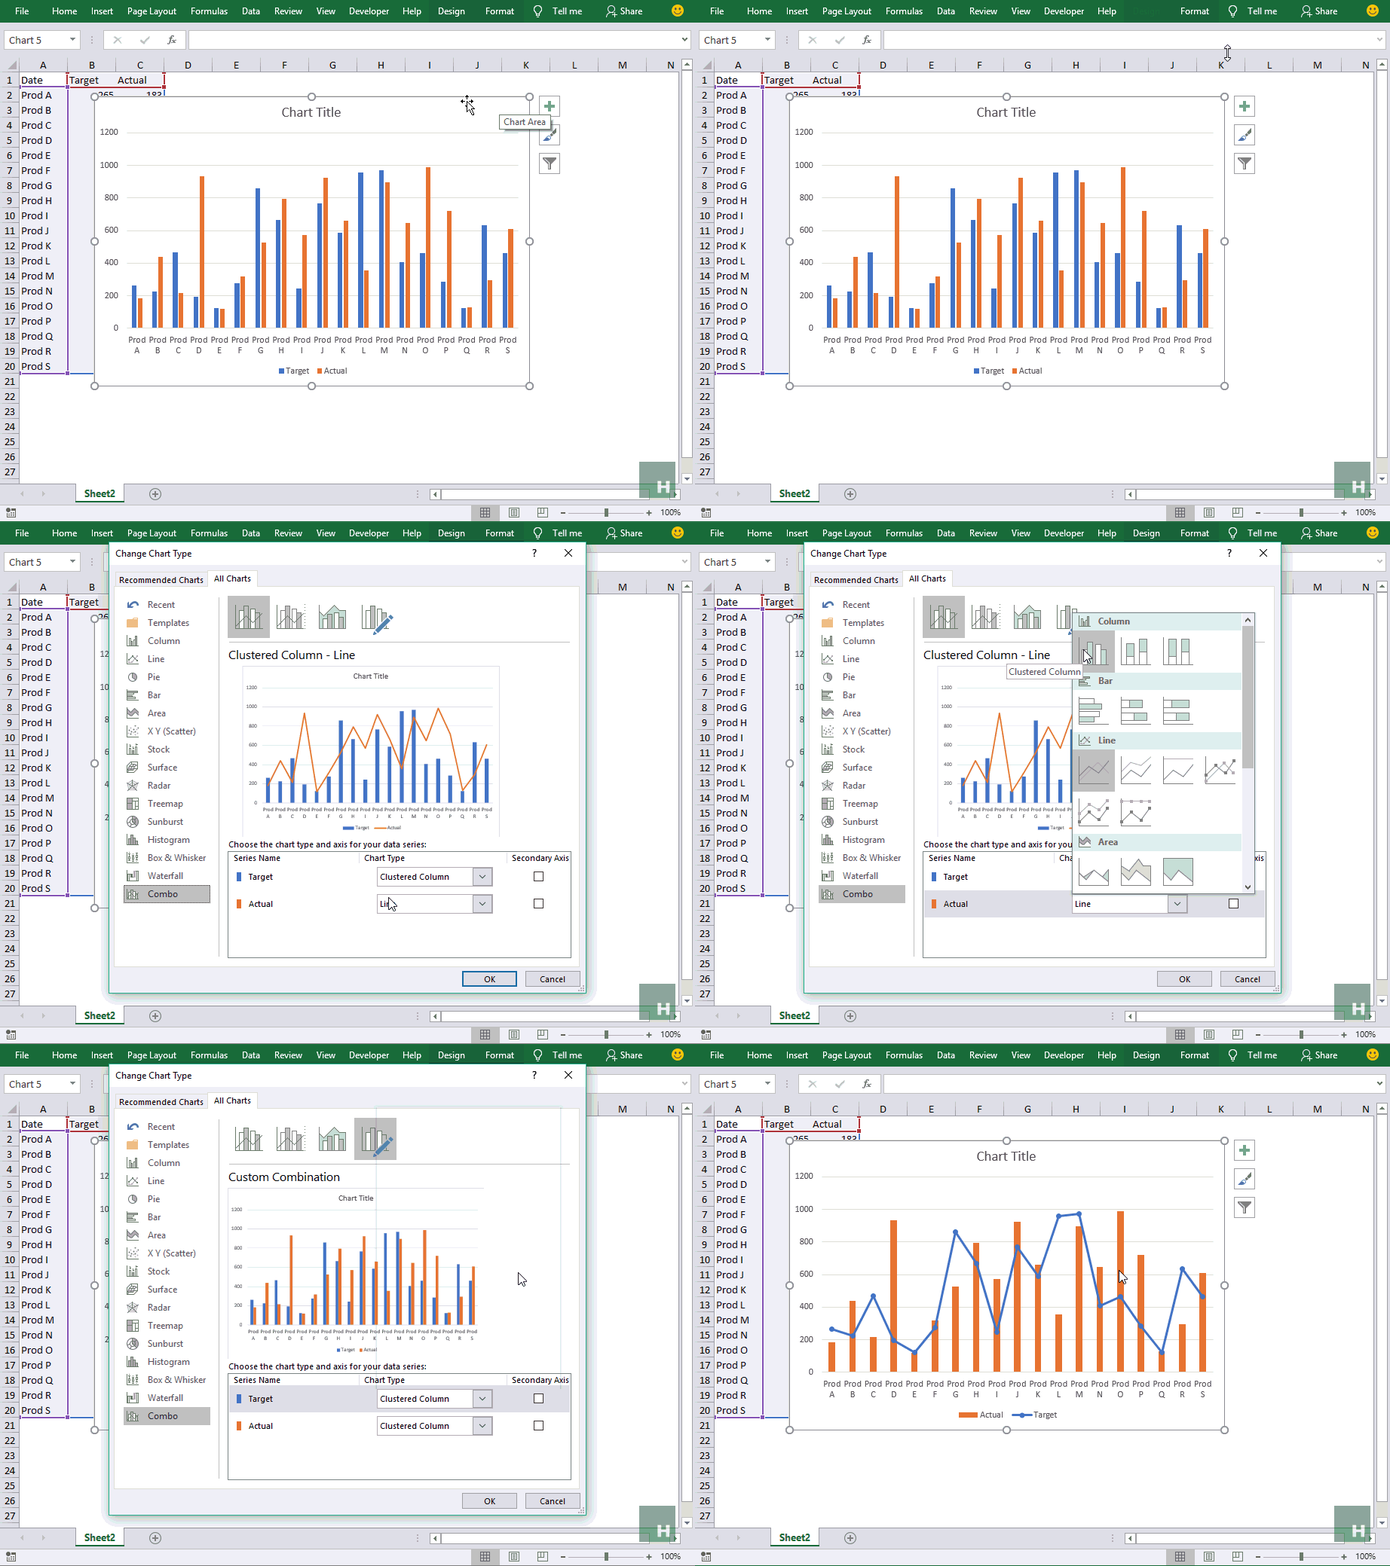
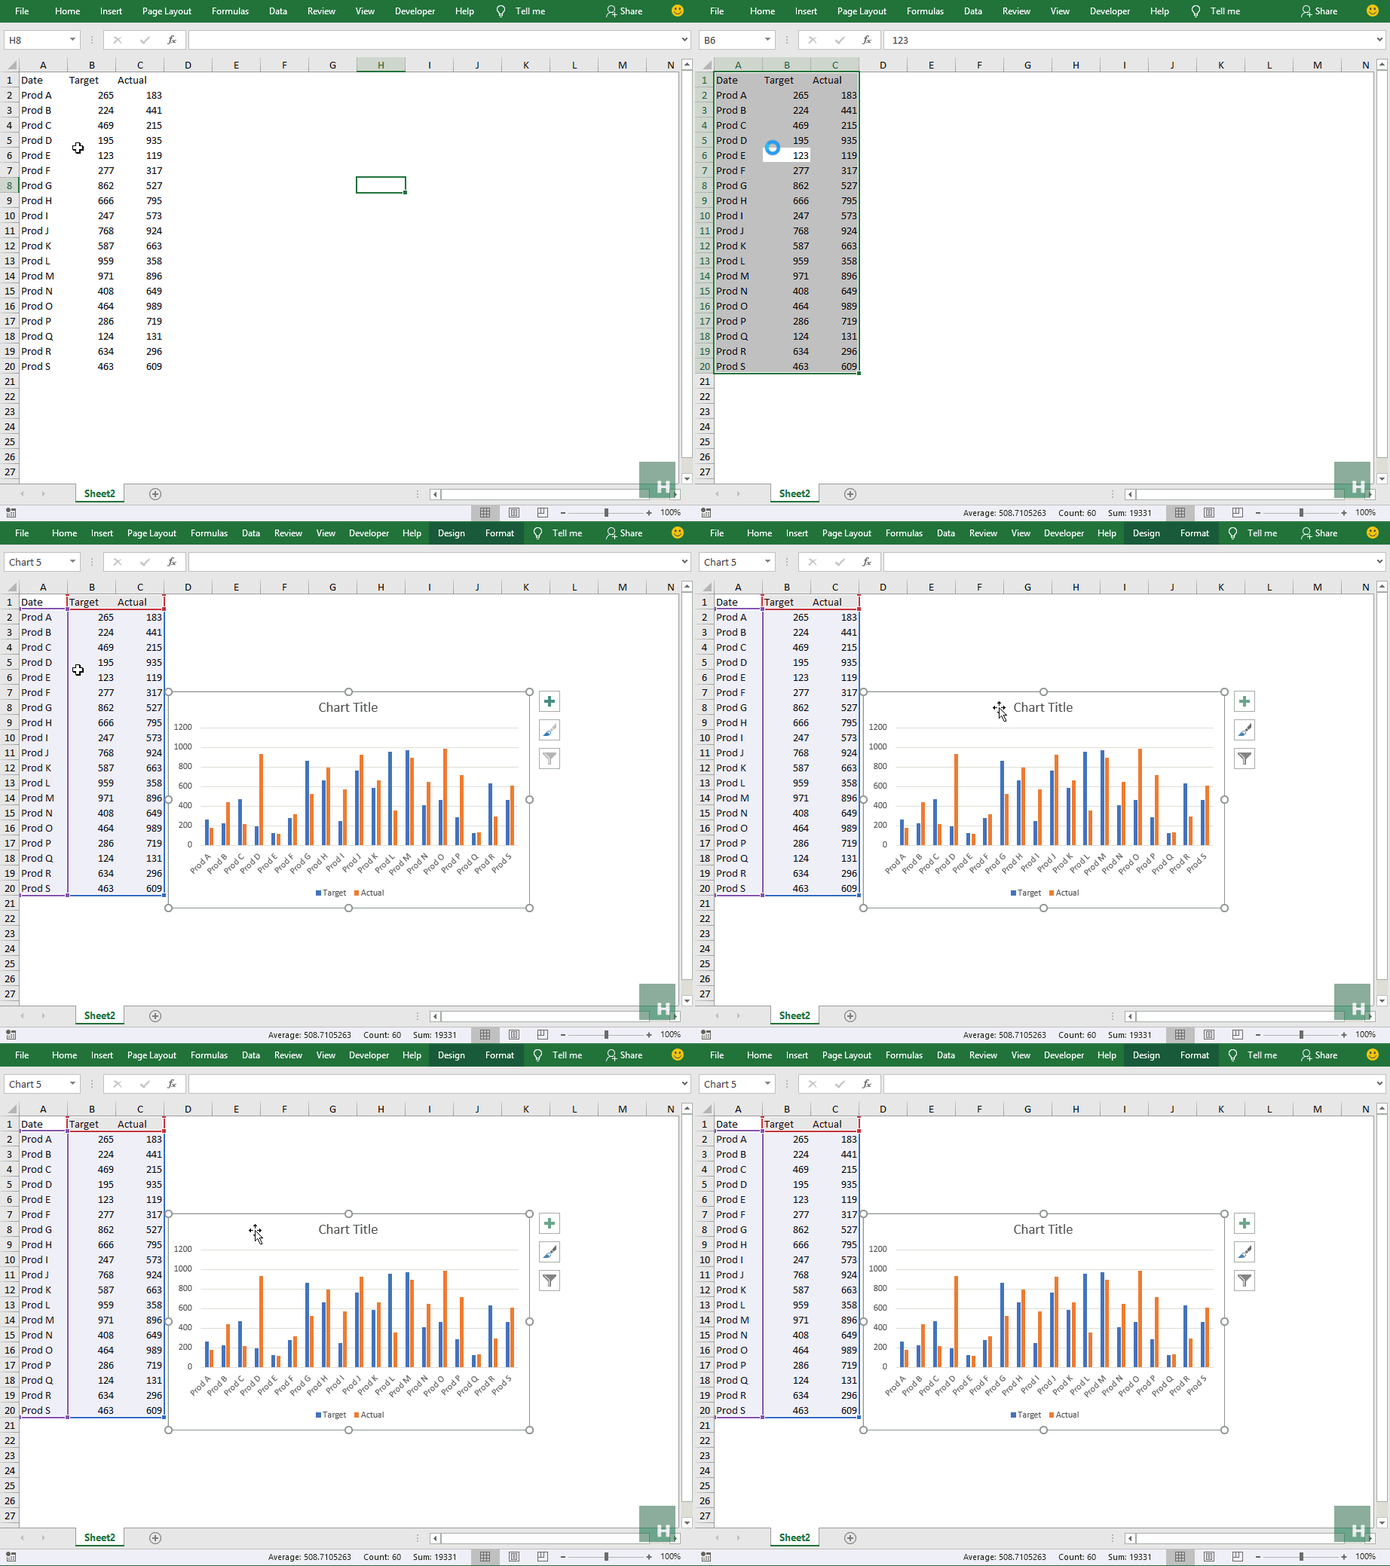 Step 2: Having the chart active, go to design tab > click change type button. A new window will pop up. Select combo from the list on the left > change chart type for target series line with markers > Click OK.
 Step 3: Right-click on the line series in chart > Click Format data series > From the bar on the right click Fill and line icon > Under line select No line
Step 4: Click Marker > Expand Marker options > Click Built-in > From the drop-down select the marker you like, I went with dash as its more visible on the chart. Increase the size to 15.
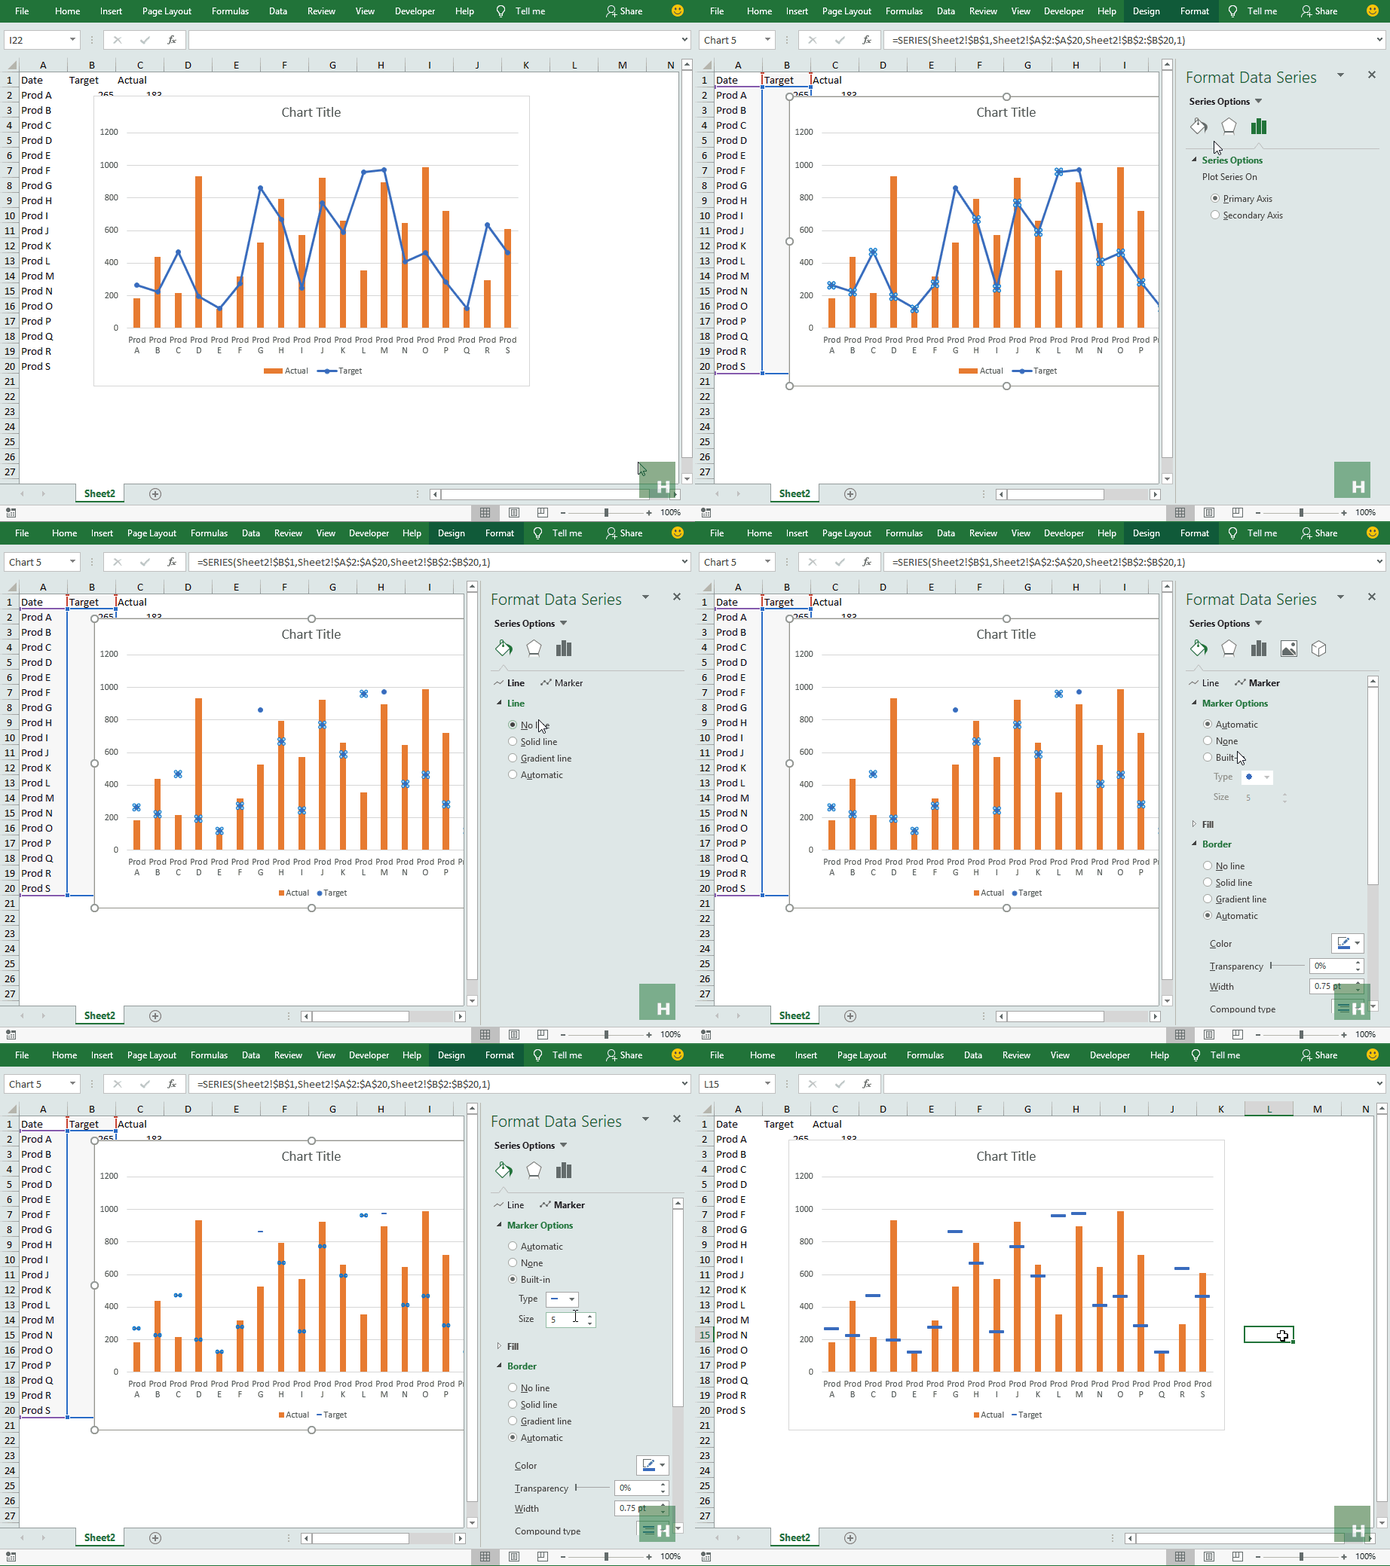 Step 5: Remove the chart elements you don’t need. I removed almost everything from title, label, and gridlines to have the following result:
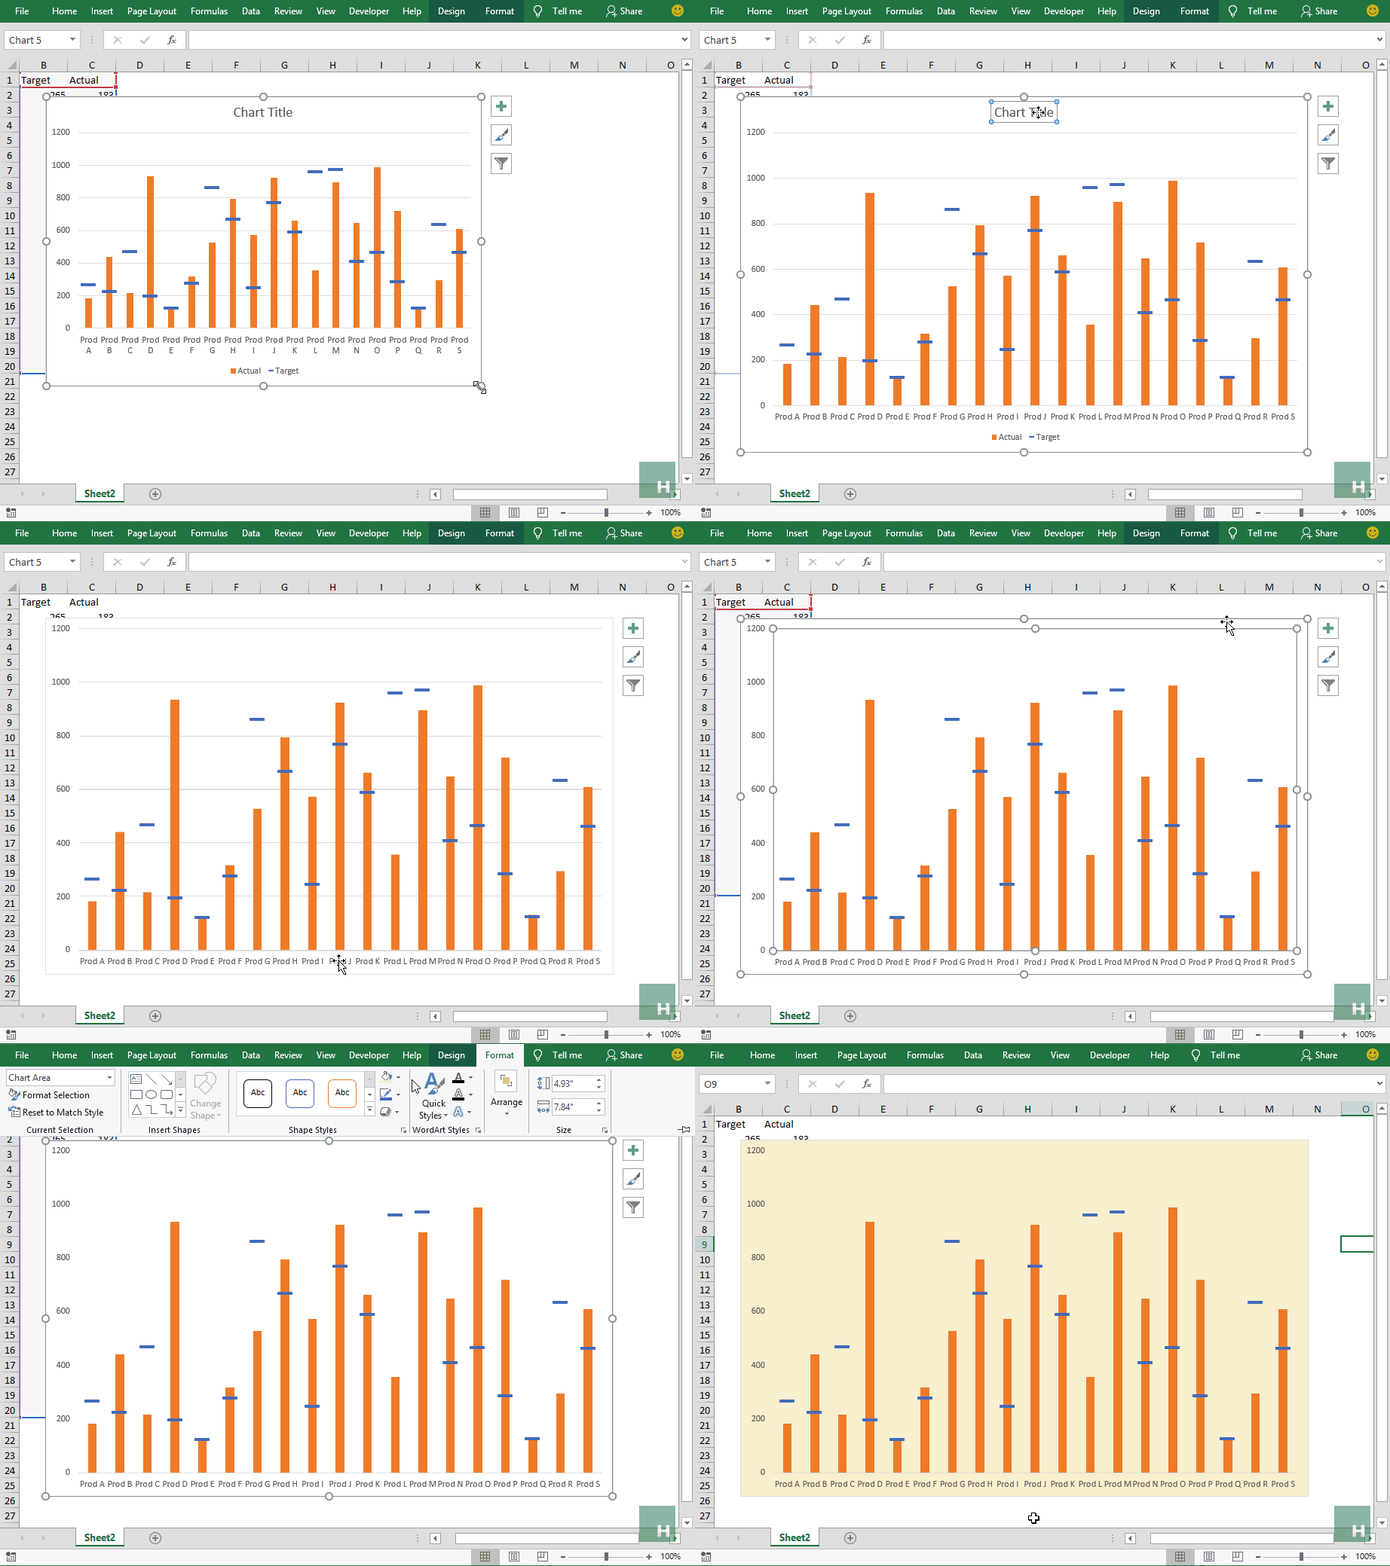
Blazing fast charting in Excel! I mean accountants and analysts have a lot to rejoice and this is one example 🙂
Liked the tutorial? Pin it!


Is it possible to download an excel example and disable the video?
Thank you
Thank you so much for your blog posts! As a Budget Analyst I am constantly exploring ways to automate and expand my Excel tasks. You helped with it.
Very useful and interesting to learn
Awesome Hassan, making the life easy for people with less knowhow on excel. Really commendable on your part and wish you best. Can I seek your assistance as I m looking out for a spreadsheet for revenue projections for finance lease product? Best rgds and hope to get your help. Asim Shafique
Thanks for all your sharing.
i want know what soft do you use to create the gif pictures.
Sorry for my bad english, i am french speaker.
Thank you for sharing you excel expertise Hasaan. I really learned a lot.
Im a new subscriber.
This is really exciting and would like to follow along. However I cant find the link to
“Download this Excel workbook containing sample data and follow the steps in this tutorial to learn the technique better.”
Is it available to download?
Thanks, I have learned o much from theae tutorials. 🙂
Oops! Updated now with the tutorial file.
Glad that you are learning 🙂
Happy excelling!