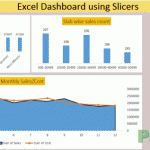
Making Sales Dashboard using Excel Slicers - How To
So many reasons why not to hate Excel dashboards. They are beautiful, they are dynamic, they make everything super easy to understand. And not to mention it one cool way to grab attention at workplace (if that is the only thing you can do ) So here is what we are about to learn today. […]
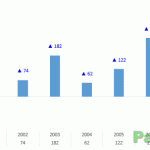
Custom Data Labels with Colors and Symbols in Excel Charts - [How To]
Is it possible to have colored data labels like red for negatives and blue or green for positive values inside excel chart? This question was asked by some when I posted Variance Analysis in Excel – Making better Budget Vs Actual charts as this shows the use of custom data labels that includes upward and downward arrows with positive and […]
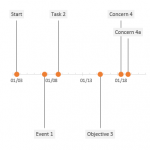
Creating Timelines in Excel [How To]
Just recently I upgraded the office suit to 2013. And the first thing I did is to see how Excel looks. Its even better. Sublime, simple, to the point and just like the way bean counters like it. Great job developers. The obvious next stop was to see the templates and the first template that […]
Making Interactive Charts in Excel [How To]
Graphs and charts are amazing tools to understand the information in the blink of an eye. It not only saves you from reading at all levels. That is why charts and Excel is one combination not to miss when you are learning Microsoft Excel application. But sometimes even the charts are so laborious that you wish […]
Creating and Working with Dynamic Charts in Excel
Title should be “making charts dance to your command in Excel” but lets keep it technical OK let me be very quick at it as I learnt about this almost by chance. I used to thought that when you create a chart the selected range is locked tight so show graph therefore if the data […]