Lets admit one thing, given time everyone can make good decisions. But time is one thing that make everything else scarce. From physical resources to funds and most importantly information. If you are given time, you can arrange and navigate through many of the limiting factors.
Suppose you have a product to launch. Market research has been conducted so some information is available, but you need to decide which price will give you the maximum profit. Should we run for the calculator, sitting down fiddling with numbers for every price you have in mind? I have a better solution that gives you answers in a heart beat! Take a look at this:
So we have a data with usual items that we see in profit and loss statement. To make the financial model a little realistic, I have linked the units demanded with price per unit with the following equation:
D = Q – P x f
D is total number of units entity is able to sell at a particular per unit price.
Q is the maximum demand
P is the price per unit entity is charging
f is the factor by which “D” decreases for every cent increase in the per unit price
So simple demand-price relation, if price increases the overall demand contracts. So you can see more the increase in price bigger the product of P and f and bigger the number deducted from Q. Alright basics covered.
Currently the calculations are done on the basis of $5 per unit.
But I want to know how each of the important elements of profit calculation change to change in price? As I said earlier its a cumbersome task as you have recalculate everything. But with Excel data tables its super quick.
So lets start with bare data i.e. the profit report.
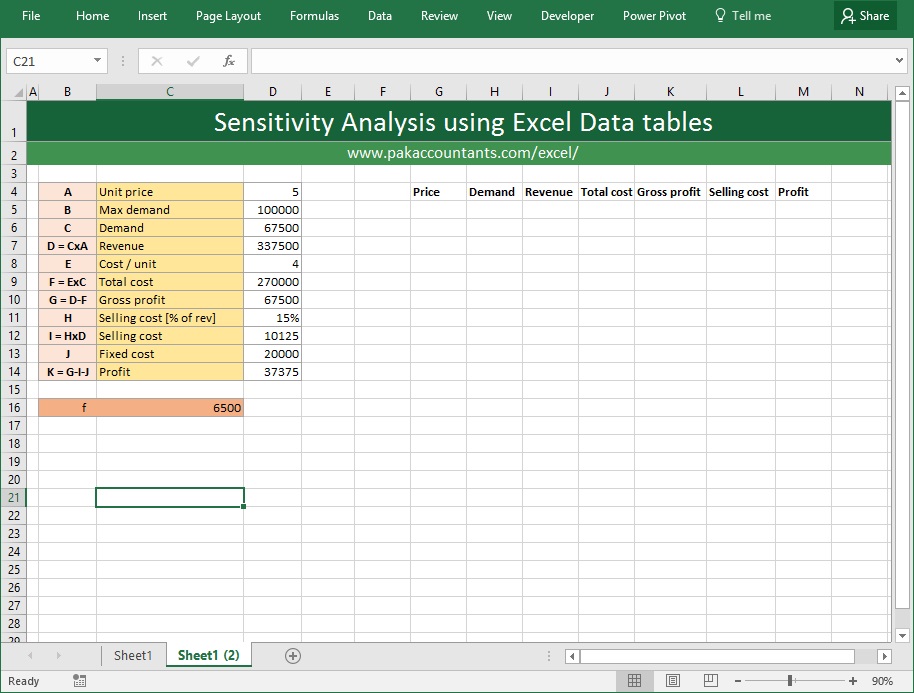
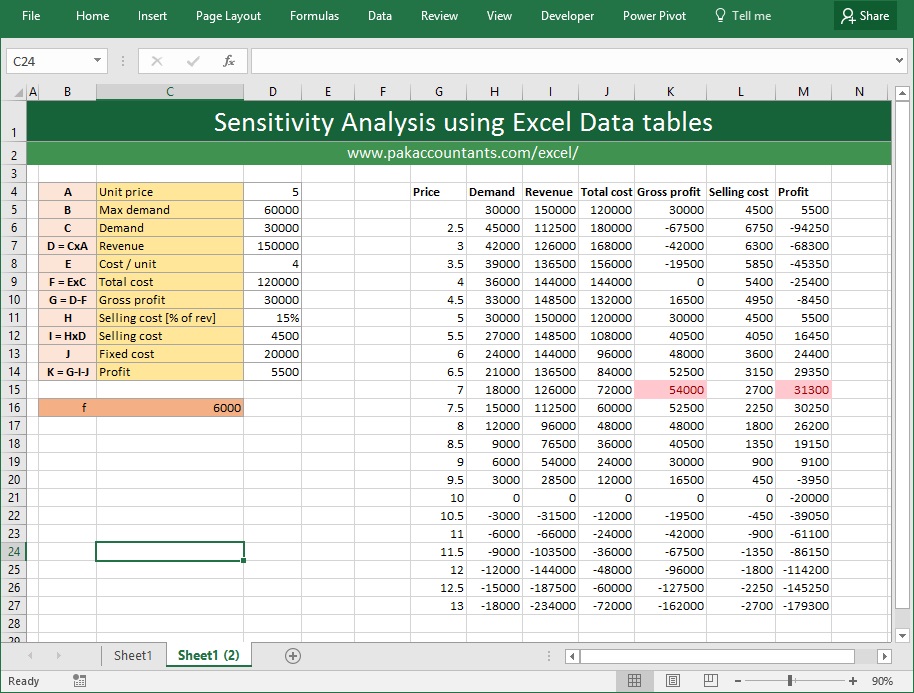
The important calculation factors are demand, revenue, total cost, gross profit, selling cost and profit. So I have arranged them on the right and fetched their values from the respective cells from left with appropriate cell references.
Now in column G I will list down all the prices against which I want to see profit. I started with 2.5 and extended it to 13. Once done, select the whole range from G5 till M28. Go to data tab > forecast group > click what-if analysis button > click data table. And BAM!
To make it more easy for you to find the maximum profit, simply select the profit figures, go to home tab > styles group > conditional formatting > top/bottom 10 rules > top 10 items. From the pop up reduce the value to 1. Click OK. Now your top value is highlighted.
I can easily see what is the best price for the product charging too less and too high both will give you lesser overall profit. In our case it is 10 keeping everything else constant. But we can draw additional conclusions as well.
- By changing the price factor, I can change the elasticity of the product. More the f amount more the product is elastic.
- Break-even point can also be assessed, though not accurately all the time.
By changing the variables, I can also assess for which price demand will fall to zero and below:
You can see in the above situation that at 10, the effective demand has fallen to zero. And for any additional price, it seems entity will have to pay to customer to sell any unit at all.
And many others if we keep on changing the variables.
So there you have it, one really fast way to get the job done and excel further.
Dear sir I have one coal blending problem. In this problem I have two different coals one is local coal and other one is imported coal. I blend them on different ratios for industry requirement. main object is to minimize the cost of coal for cement industry. I need model for this and sensitivity analysis in excel.
In the first part it says that Profit is equal to G (gross profit) + J (fixed cost).
shouldn’t that be minus?
Nice one!
Can you please recheck the formula for I; Is it HxC ot HxD? The formula description is HxD where as it is computing on HxC.
What is the “f” for? How it is used in the computation?
Nice one !
How do you manage your animated gif file out of xls the way you show it here. It is very helpful.
Best wishes,
Sharif
Looks like there is mistake in the table, the selling cost I=HxC intead of I=HxD.
Selling costs are calculated on revenue basis. Multiplying the percentage with demand will not give us selling cost. So it is correct.
Great !
BTW how do you engineer your animated gif out of xls the way you show it here. It is great
!!
best
Thanks Patrick and welcome to PakAccountants.com,
Its a simple screen grab using Camtasia and exporting it as gif.
Regards
– Hasaan
Amazed at the way you did it. BTW how do you do your animated GIF out of xls the way they are shown here? That is just greatly enhancing the understanding of the process you went through.
Great initiative in any way!!
I am trying to build sensitivity analysis table. I am no table to demand change as the price changes. Could you please upload the excel file of sensitivity analysid
There are two demands mentioned. ‘Max demand’ and ‘Demand’
Max demand is an independent variable. Where as Demand is a dependent one. For demand I have put in the following formula in cell D6
=D5-C16*D4
Hope it helps.
-Hasaan