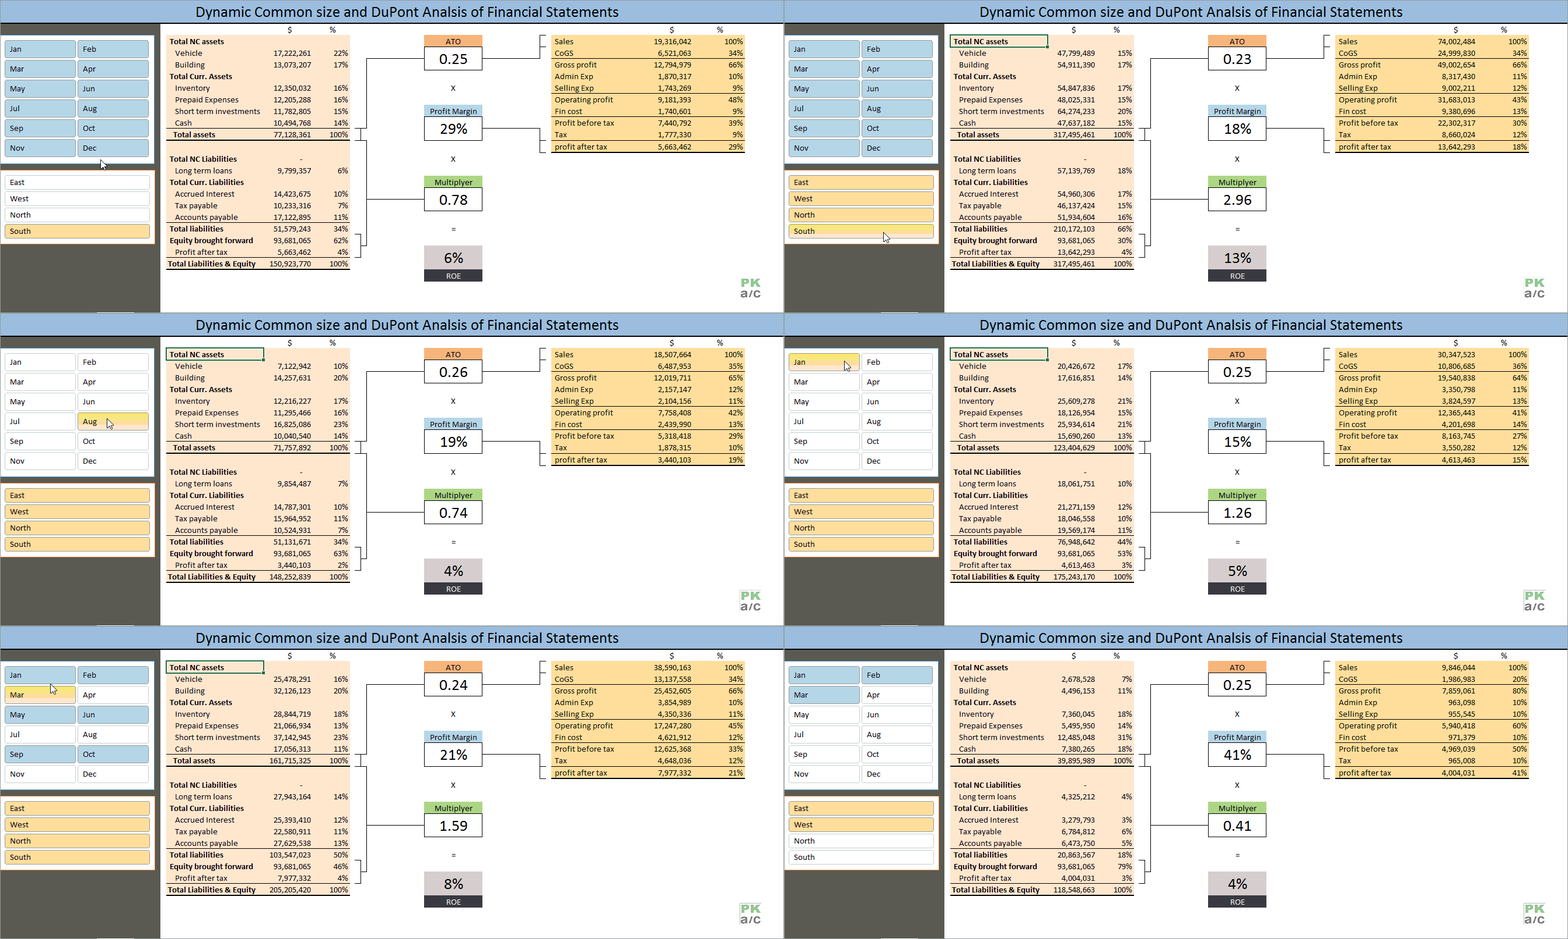
What if you have to make few analysis together in Excel like common-size analysis, ratio analysis and duPont analysis, well this is what I did this weekend. And the best part is that it is dynamic as you can filter the data using slicers and it updates automatically for the month(s) and department(s) you selected
How is this done
The basic idea is to make the data filterable using slicers for which the essential component is pivot tables. Method is explained in detail in this tutorial: Making Profit and Loss Statements in Excel using Pivot tables
If your data is not pivot table ready then you have to normalize it for which several methods can be employed. Check this tutorial to learn data normalization: Prepare (Normalize) the data for Pivot Tables using Power Query
Last important bit was to connect the slicers with multiple pivot tables so that all get filtered with one push of a button. I have explained this technique in detail in another Excel dashboard tutorial: Making Sales Dashboard using Excel Slicers – How To
Once everything is in place, it required few minutes to arrange the data few visual cues to aid understanding.
There is still some room at the bottom right to add ratio analysis for the important aspects and they will update automatically as well.
And here is the link to download the file with financial statements’ common-size and duPont analysis completely done.
Have any example to share? Lets see it in the comments!


How can you show value as percentage of sale in pivot table?
Thanks to Share the knowlege , ROE – Return on Equity in this ATO*Profit Margin*Multiplyer What is the Actual formula , What Integate Multiplyer what purpose we are doing this Multiplyer = Total Assets/(Equity+PAT)and ATO – Sales/Total Assets , Pls Explain actual formula ROE is Net income(annual)/Shareholder Equity is this right na , Sir Pls clear , i really confused ….
Very Great support for me in Pivot table of Accounting and financial report.
I also found this website very useful, contained a lot of knowledge of Pivot Table and computerize knowledge.
Dynamic Common size of Dupont very useful. But my job has no department of (North ,West,……)
Excellent
Very useful Site
thanks for every body
I found this page very useful.At the moment am having problem with doing forcasting using excel since my add ins dont have the statistic pro do the.
How should I use the excel that only have the tool park to do the random walk and other forcasting.
Thanks