Excel Pivot Table – Introduction: What, Why and How for Absolute Beginners [1 of...
Excel is surely a cavalry of features. And if we count the ways in which each feature can be useful just makes the whole think almost countless. However, for every feature one must know...
Excel Pivot Table Slicers: Old Filters got Overhauled!
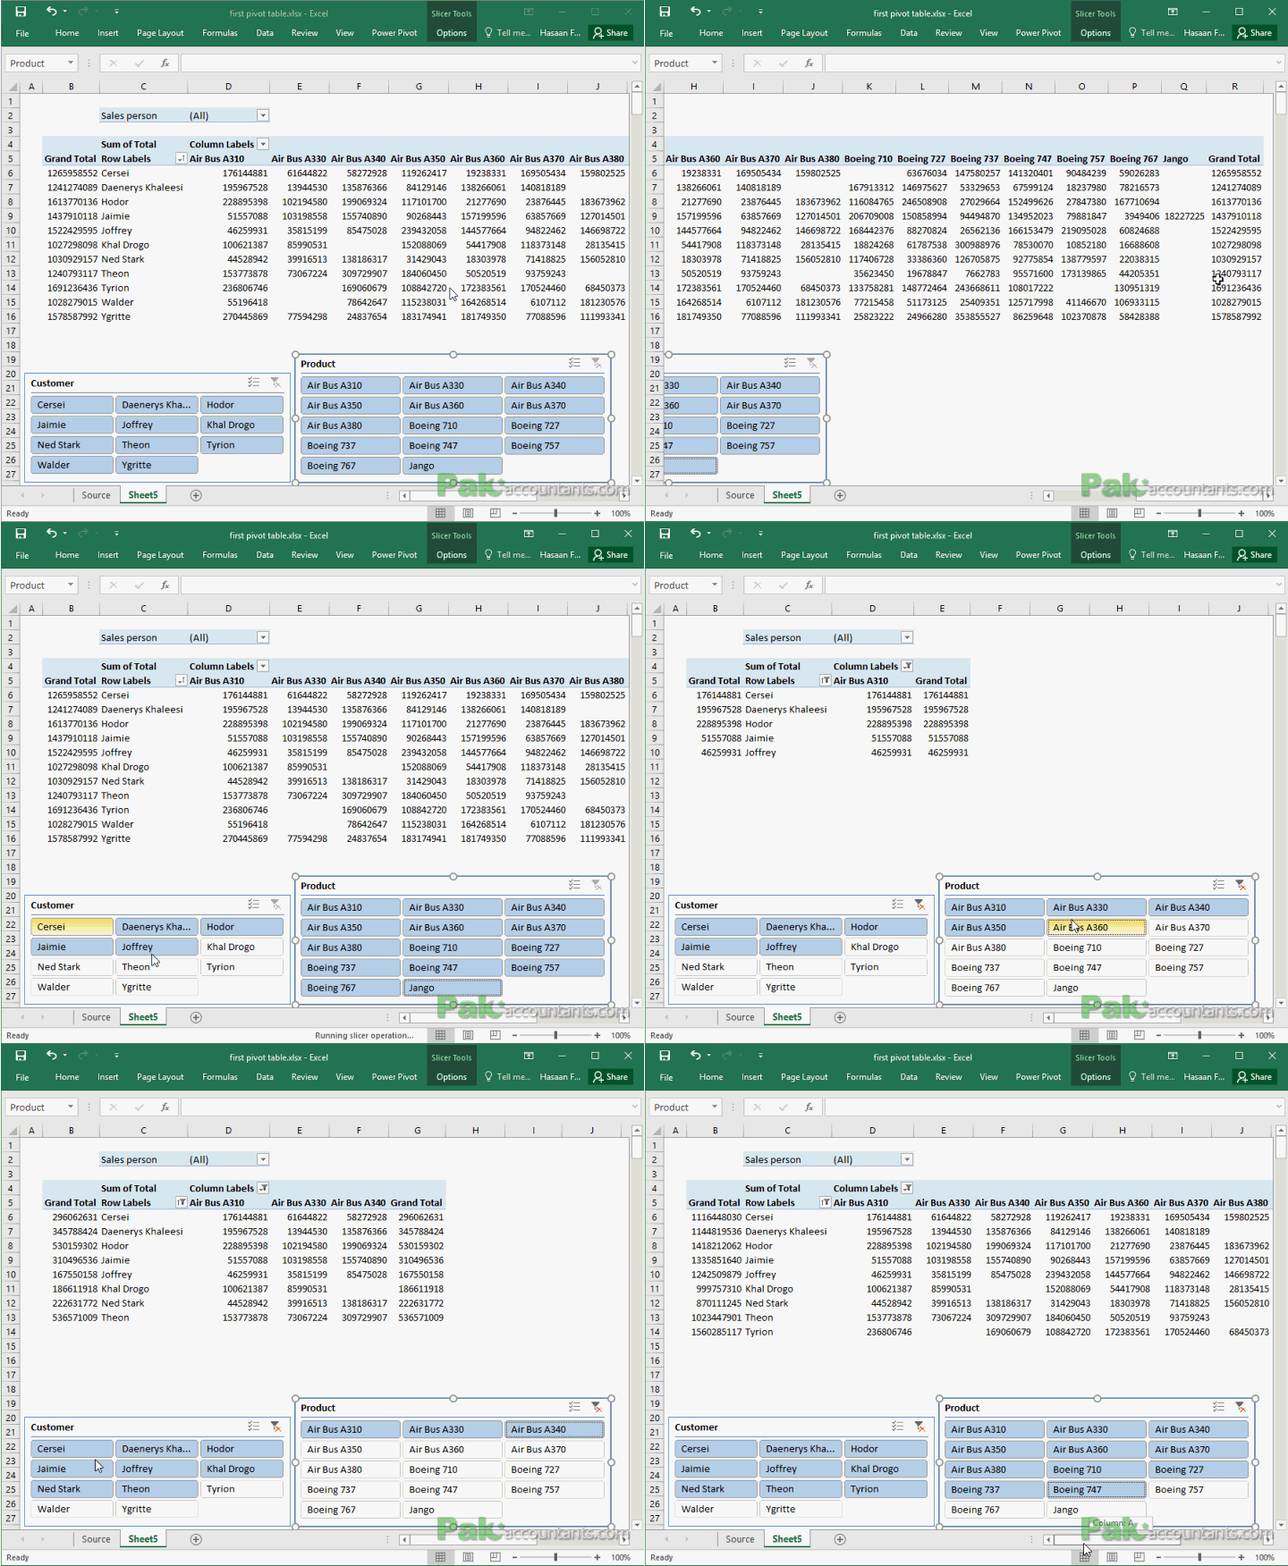
First things first, this post is strictly for those who have Excel 2010 or later installed. But is this a warning not to read this post if you have older versions? NO! The intention...
Restructuring (Normalizing) data for Pivot tables using Pivot tables – How To
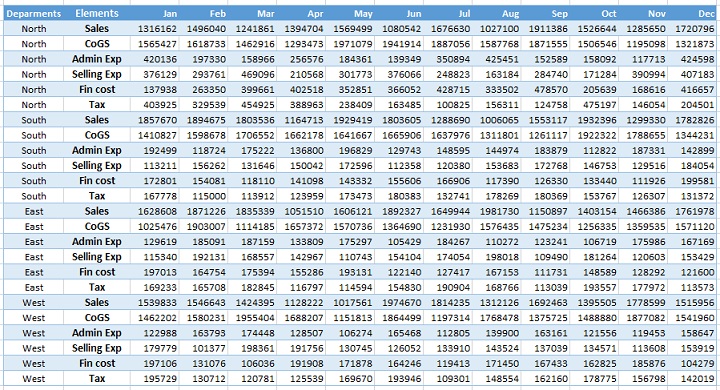
Last time I discussed the use of Power Query to restructure data for pivot table purposes if it is not arranged in columnar format. Today we will be learning how to normalize the data for...
Making Aging Analysis Reports using Excel Pivot Tables – How To
Last time when I discussed preparing aging analysis in Excel, I used formula approach to do it. I used the combination of IF and TODAY functions and then used conditional formatting and sparklines to...
Excel Pivot Tables – Grouping Dates by Week Within Months, Quarters or Years –...
Earlier we learned about grouping and ungrouping time related information very easily using excel pivot tables. It saves huge amount of time in preparing summary pivot table reports with different dimensions of time.
However, we...
Making Cash flow summary in Excel using Pivot tables with data on multiple worksheets
Cash flow summaries are scary because of piles of data. But it is a routine work and accountants have to go through it every accounting period (monthly, quarterly and/or annually).
Few days back I was approached...
Make a distinct count of unique values in Excel – How To
Excel is a love of life for everyone who wants to tame the data by making much larger data in short yet precise data without losing its meaning and value. But what if you...
Prepare (Normalize) the data for Pivot Tables using Power Query
Pivot tables is a love of life for many Excel heads for its ability to move elements of reports easily is pure awesomeness. Pivot table has greatly improved since improv. But it still has limitations. And one...
Create Data Validation lists from Unsorted data with duplicates in Excel [How To]
Today I finally decided to make an Excel dashboard on debtors aging analysis. The main reasons to do this dashboard were that:
I thought now enough knowledge has been delivered to my cult followers that...
Stock Ageing Analysis Reports using Excel – How To
Stock is one of the most important investment made by the entity. Optimum quantity and turnover period is essential for entity to be successful. Faster the conversion, better the prospects for entity as inventories...


![Excel Pivot Table – Introduction: What, Why and How for Absolute Beginners [1 of 2]](https://pakaccountants.com/wp-content/uploads/2012/09/excel-page-featured-image.png)


