Making Interactive Charts in Excel [How To]
Graphs and charts are amazing tools to understand the information in the blink of an eye. It not only saves you from reading at all levels. That is why charts and Excel is one...
Conditional Charts in Excel – Workaround + How To
Last time we learnt how to make simple dial charts. There is so much to be discussed as basics to Excel charting but without little fun and doing out of ordinary is what everyone...
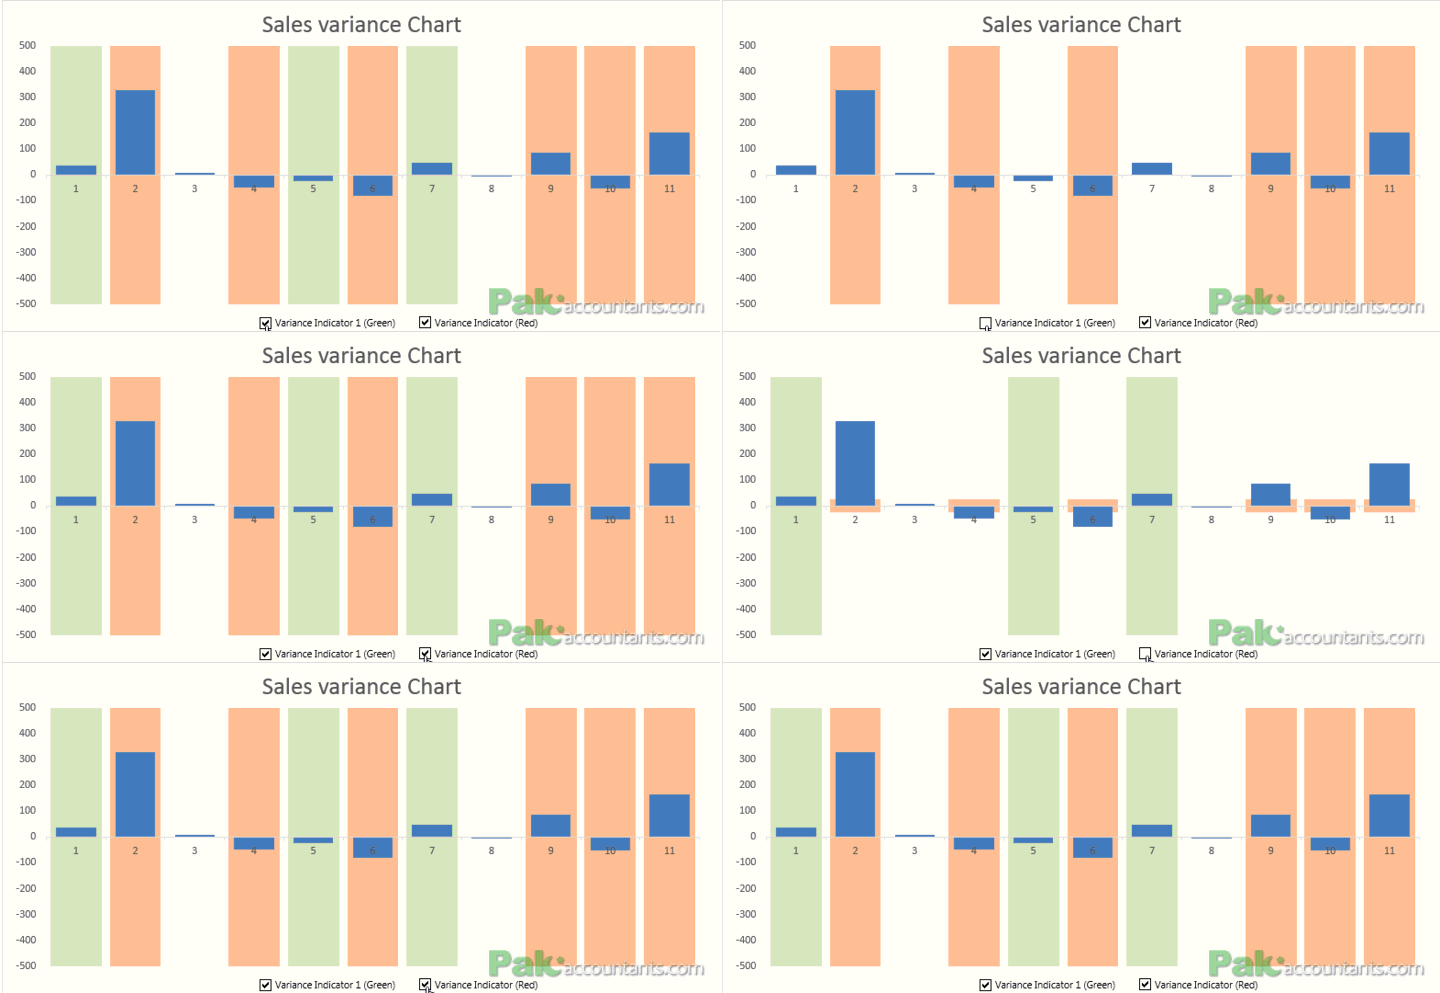
Highlight instances in Excel charts in different colors with shaded bars in background
Suppose you have a variance chart and want to highlight those that require inquiry. Further suppose that you have two levels of inquiry:
Variances that require moderate inquiry (highlighted by for example green color)
Variance...
Create Simple Dial Charts in Excel – How To
Charting or graphing is one of the biggest punch Excel has. Visual presentation of data greatly improves user's ability to comprehend the information and significantly cuts down the time to take decisions. That is...
Creating and Working with Dynamic Charts in Excel
Title should be "making charts dance to your command in Excel" but lets keep it technical :)
OK let me be very quick at it as I learnt about this almost by chance. I used...
How to show data of hidden rows/columns in Excel Charts
By default if you hide a certain row or column of a data on which a chart is based, Excel will automatically hide that data too. I must confess that I was quite annoyed...
Adding a Secondary Axis in Excel Chart – Making Double or Dual Axis Charts...
Excel charts are one of the best tools to give eyes to numbers. And Excel takes it further by letting you easily customize your charts.
Excel has many customization options for Excel charts to help...


![Creating Excel charts with Subcategory axis – [Quick Tip]](https://pakaccountants.com/wp-content/uploads/2013/05/excel-tips-and-tricks.png)
![Custom Data Labels with Colors and Symbols in Excel Charts – [How To]](https://pakaccountants.com/wp-content/uploads/2014/09/data-label-chart-1.gif)


